from BPTK_Py.bptk import bptk
bptk = bptk()Advanced Plotting Features
Using advanced plotting features in the BPTK-Py simulation framework.
How To: Advanced Plotting Features
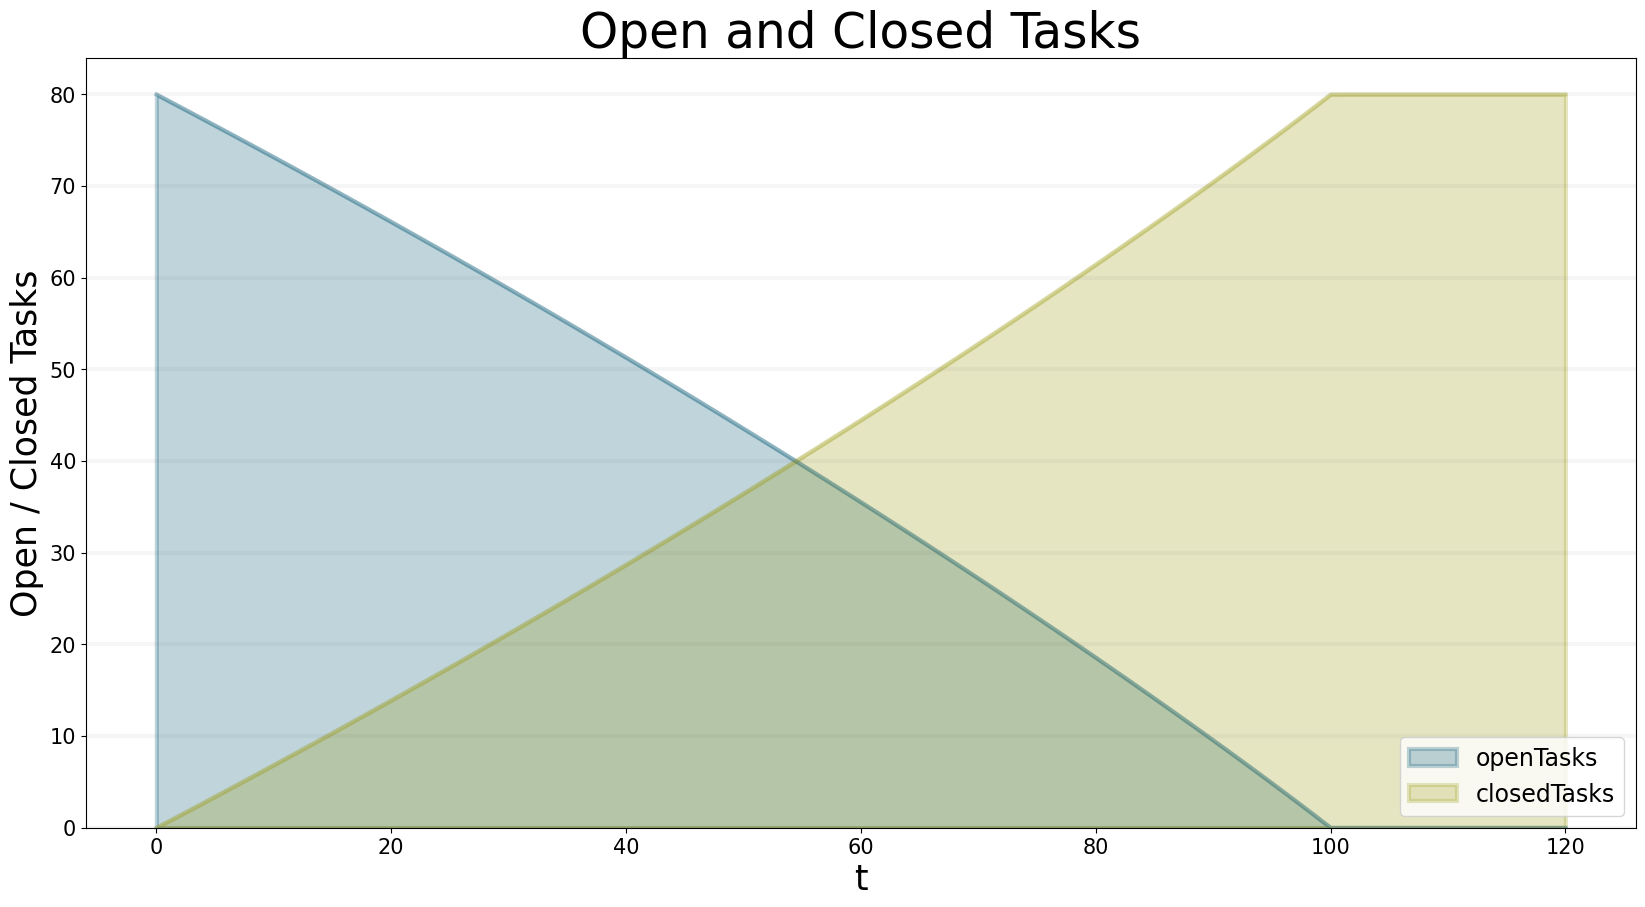
Plotting Multiple Equations
Let’s dive right into the first example. We may want to simulate different equations for a specific simulation scenario.
We want to simulate the equation ‘openTasks’ and ‘closedTasks’ for the scenario “scenario80”. Play around with the parameters for the x/y labels and title.
You may either use the scenario_managers parameter and supply a list of the names of all scenario managers you want to plot the simulation results for or use the specific scenarios’ names. If you have the same scenario name in different scenario managers both the name of the scenario and scenario manager are required.
bptk.plot_scenarios(
    scenario_managers=["smSimpleProjectManagement"],
    scenarios=["scenario80"],
    equations=['openTasks',"closedTasks"],
    title="Open and Closed Tasks",
    x_label="t",
    y_label="Open / Closed Tasks",
)
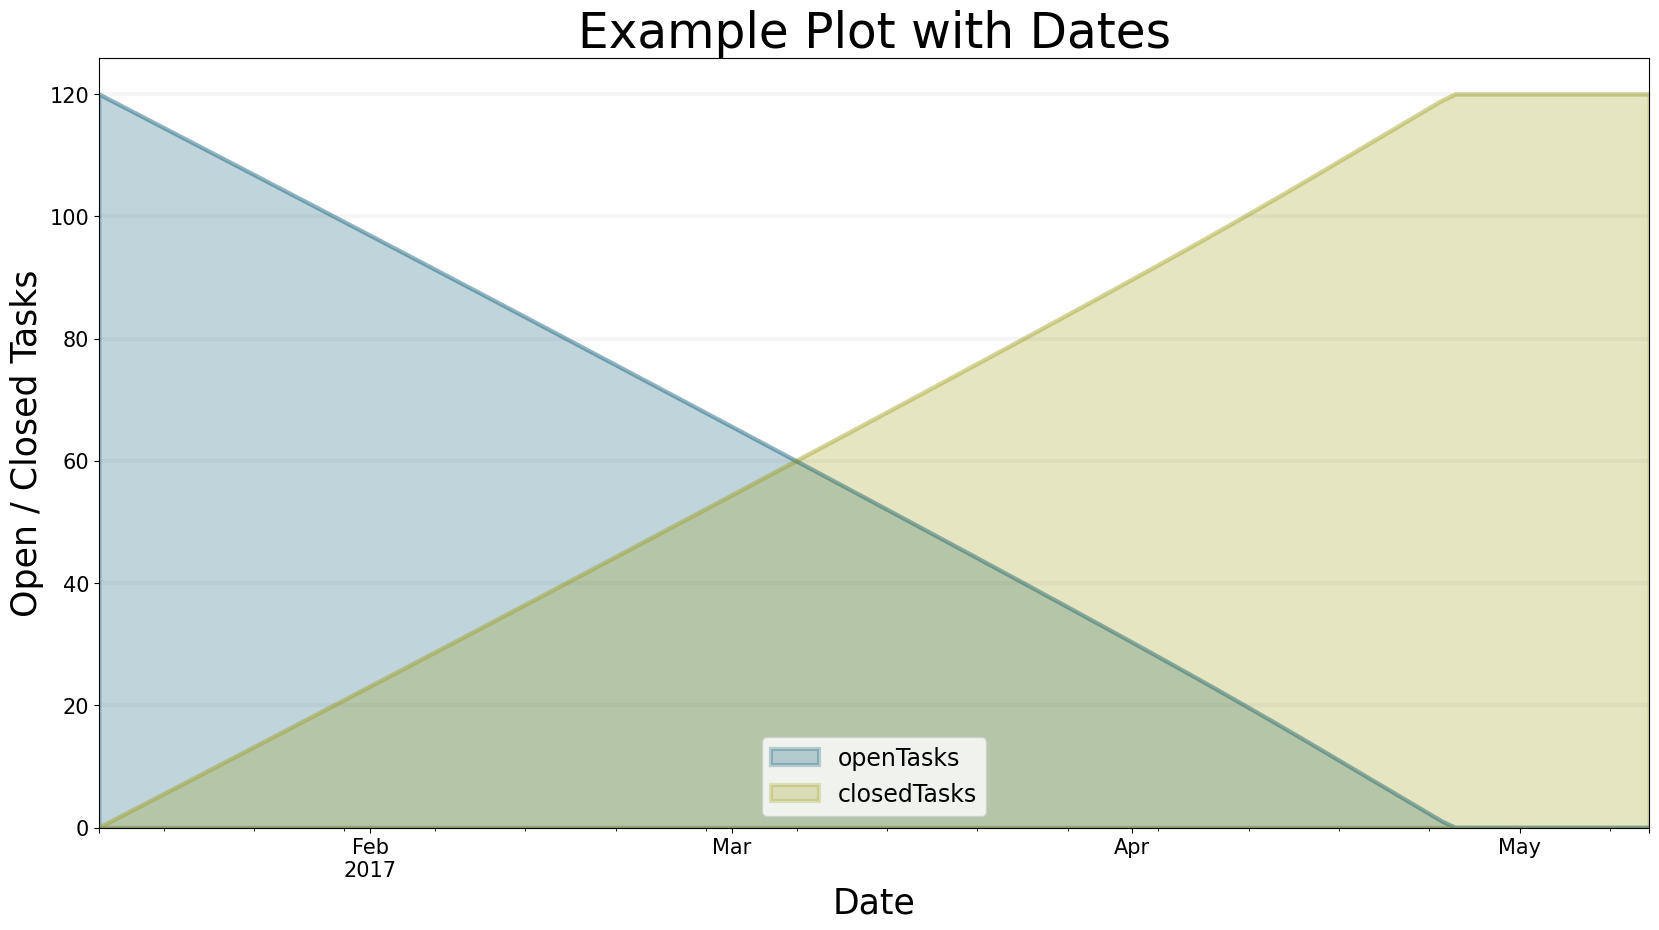
Changing Start Date And Frequency
In the example above, we did not specify the freq and start_date parameters. The series just plots the values of t for the x-axis. Using the mentioned parameters, you can generate time-series data. Let’s specify the x-axis by setting freq="M"and start_date="1/11/2017".
bptk.plot_scenarios(
    scenario_managers=["smSimpleProjectManagement"],
    scenarios=["scenario120"],
    equations=['openTasks',"closedTasks"],
    title="Example Plot with Dates",
    x_label="Date",
    y_label="Open / Closed Tasks",
    start_date="1/11/2017",
    freq="D"
)
Renaming The Series
It is often required to rename the series_names parameters to something more humanly readable. This can be achieved by using Python’s dict notation: { equation_name : rename_to }.
The dictionary serves as a set of replacement names. To correctly rename the series, it is helpful to understand how the framework sets the name of a series to avoid ambiguity in series names. If more than one scenario manager is used for plotting, bptk_py will use the following series naming convention: "scenarioManager"_"scenario"_"equation". To replace these names, use series_names={"scenarioManager_scenario_equation": "new name"}.
Execute the following cell and see how we rename the series:
bptk.plot_scenarios(
    scenario_managers=["smSimpleProjectManagement","anotherSimpleProjectManagement"],
    scenarios=["scenario80"],
    equations=['openTasks',"closedTasks"],
    title="Example Plot with dates, multiple scenario managers and renamed series \n and a very long headline",
    x_label="Date",
    y_label="Open / Closed Tasks",
    start_date="1/11/2017",
    freq="D",
    series_names={
        "anotherSimpleProjectManagement_scenario80_openTasks" : "Open Tasks another manager" ,
        "anotherSimpleProjectManagement_scenario80_closedTasks" : "Closed Tasks anoter Manager"}
)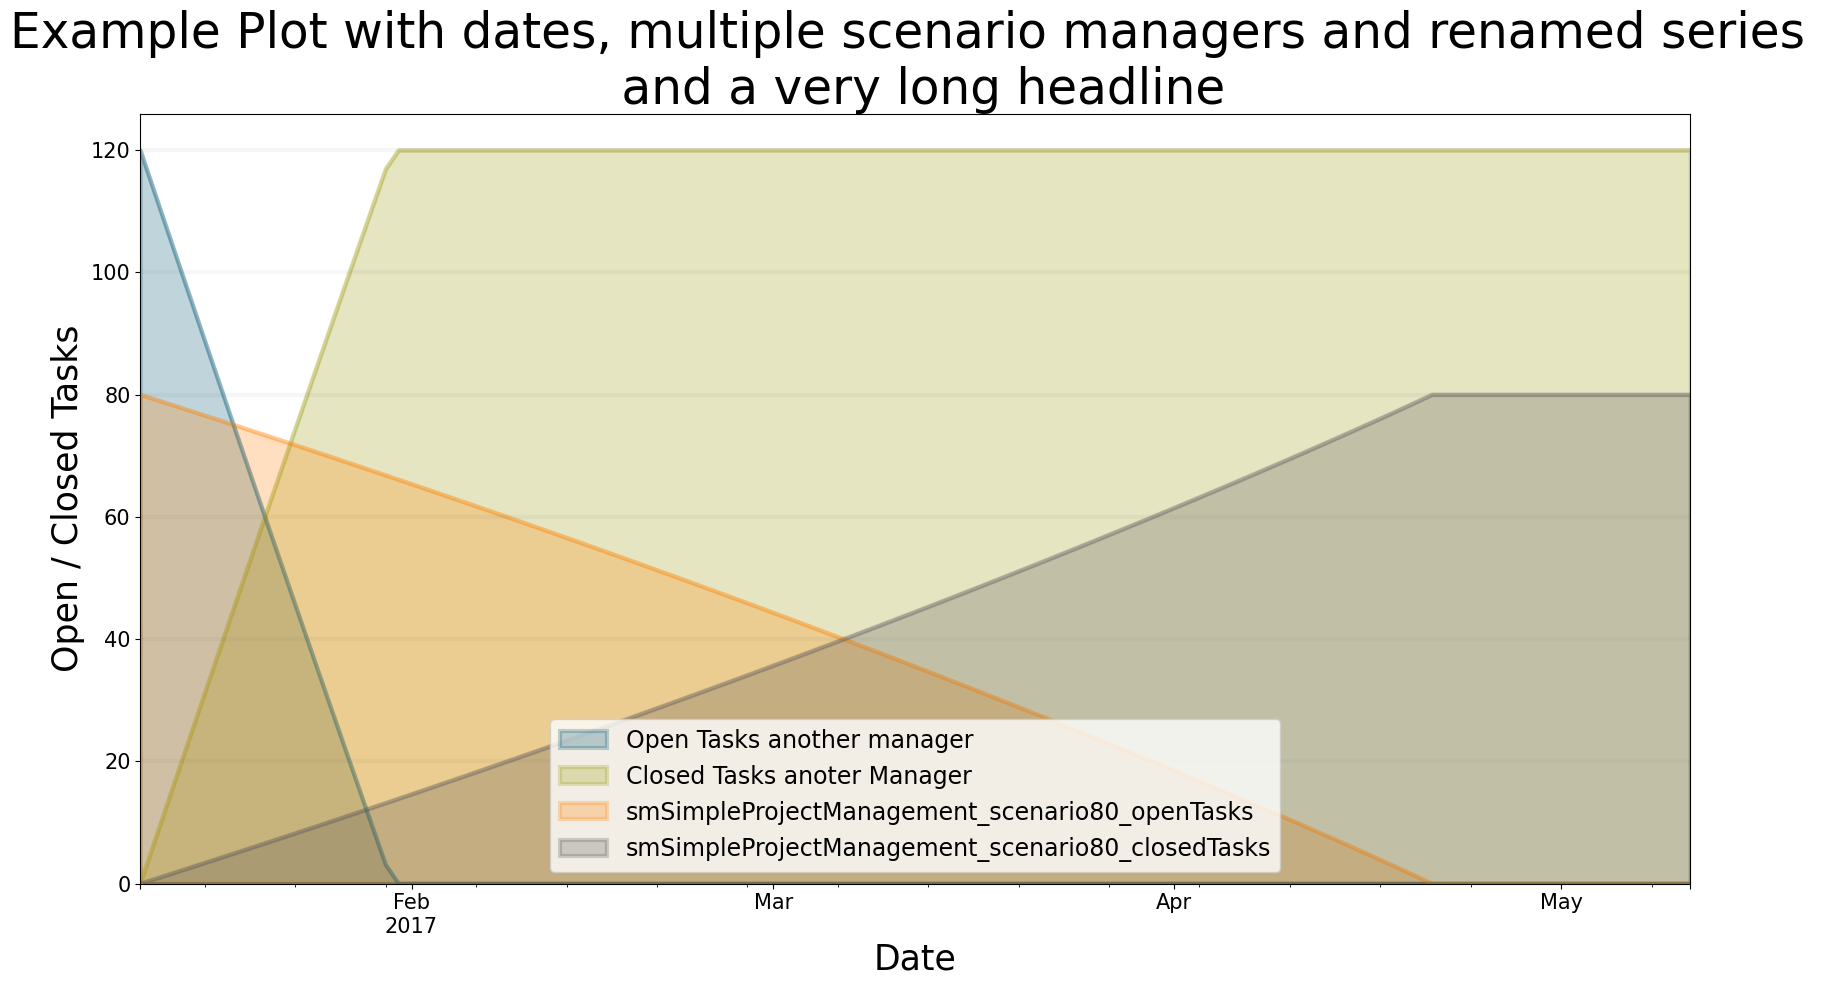
Hint: Did you notice that you may use “” to start a new line in the headline? This may come in handy for long plot titles.
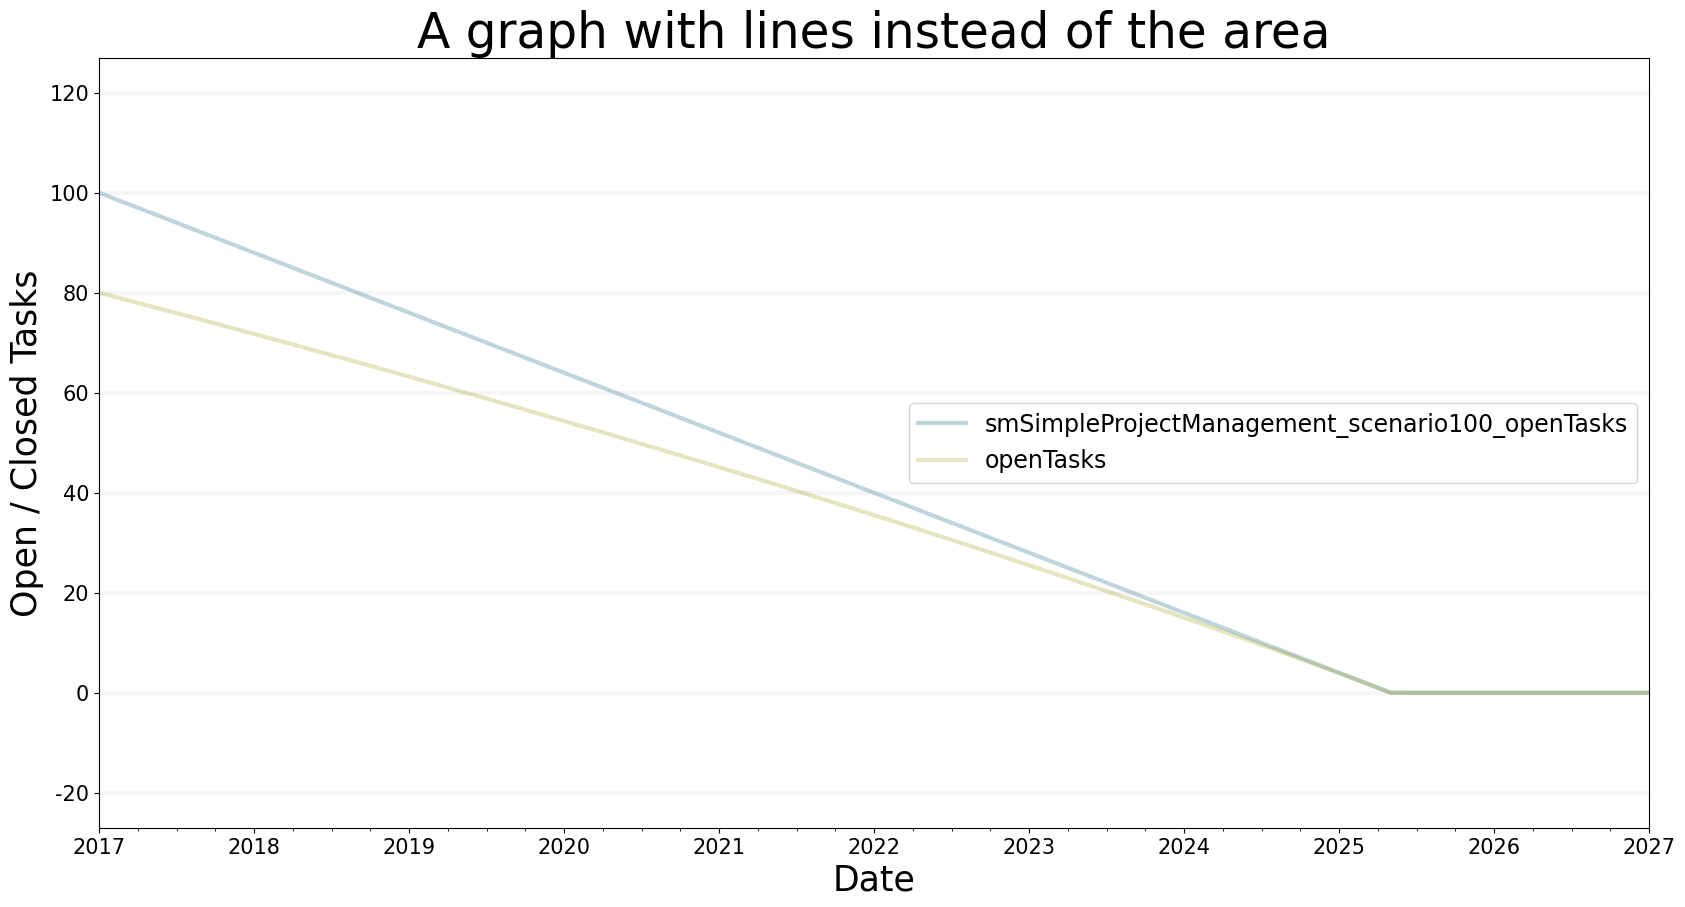
Changing The Kind Of Graph
You can change the kind of graph using the kind parameter! Let us see what happens if we set kind="line"!
bptk.plot_scenarios(
    scenario_managers=["smSimpleProjectManagement"],
    scenarios=["scenario100","scenario80"],
    equations=["openTasks"],
    stacked=False,
    freq="M",
    start_date="1/11/2017",
    title="A graph with lines instead of the area",
    x_label="Date",
    y_label="Open / Closed Tasks",
    kind="line"
)